
Property Analysis Maryland The 6-Gate System That Protects Every Maryland Flip
Maryland is the second most profitable fix-and-flip state in the country, a ranking that belongs exclusively to investors who analyze deals correctly before they buy. After funding thousands of Maryland fix-and-flip loans since 2007, Hard Money Bankers identifies the same pattern in failed flips: investors inflate ARV to make deals work on paper, underestimate renovation costs by 20% or more, and ignore the financing and holding costs that consume the 30% buffer the 70% rule is supposed to protect. The result is deals that projected $80,000 in net profit and delivered $15,000 or a loss.
The 6-Gate System is Fortune Homes MD’s structured approach to Maryland fix-and-flip property analysis. Every potential acquisition passes through all six gates in sequence. Failing any gate means walking away not renegotiating assumptions to make the numbers work. This is the discipline that separates investors who consistently produce profitable Maryland flips from those who are always one renovation overrun away from a bad year.
Gate 1: ARV Calculation the most important single number in Maryland flip analysis, and the one most commonly inflated. Gate 2: Renovation Cost Estimation where most investors underestimate by 20–40% using national averages instead of Maryland’s county-specific labor markets. Gate 3: Profit Margin Analysis the full financial model that converts gross margin to actual net profit. Gate 4: Market Comparable Analysis the neighborhood sales dynamics that confirm or challenge the ARV. Gate 5: Property Inspection the physical assessment that locks the renovation scope. Gate 6: Due Diligence Services title, liens, permits and code compliance research that finds the hidden costs that erode margin on deals that passed Gates 1–5.
At Fortune Homes MD, our MHIC-licensed team runs all six gates on every Maryland property we evaluate and the renovation scope confirmed in Gate 5 is executed by the same team that estimated it in Gate 2. No handoff between analyst and contractor. No gap between the numbers on paper and the work in the field.
We serve: Baltimore County · Montgomery County · Howard County · Prince George’s County · Anne Arundel County · Frederick County · Carroll County
📞 (410) 413-0739 📧 info@fortunehomesmd.com

Why Maryland Demands More Analysis Discipline Than Other States
Maryland’s flip market is profitable precisely because it is complex. The same conditions that create the #2 profitability ranking nationally, aging housing stock, high population density, wide price variation between neighborhoods, Baltimore City’s distinctive cost structure are the same conditions that punish under-analyzed acquisitions.
💡 Hard Money Bankers Field Insight
The $165,000 median gross profit per Maryland flip (ATTOM Q2 2025) belongs to deals where the analysis was correct. The investors who inflated ARV, underestimated renovation costs, and ignored Baltimore City-specific costs are not in the median; they are in the loss column. After funding thousands of Maryland flip loans, the correlation between pre-acquisition analysis quality and actual ROI is the clearest pattern in the data.
- Hyper-local ARV variation: In Baltimore City, ARV can swing $50,000–$100,000 between adjacent blocks. A comp pulled from the ‘wrong’ side of an intersection or from a more desirable sub-neighborhood 0.4 miles away produces a completely incorrect maximum offer. National tools like Zillow and Redfin aggregate at neighborhood or zip-code level and cannot produce the block-level precision Maryland markets require.
- County-specific renovation costs: Maryland renovation costs span $80–$250/sq ft depending on the county, the widest range of any comparable Mid-Atlantic state. A Baltimore City gut renovation on a pre-1950s rowhouse costs 2–3x what a Frederick County cosmetic renovation costs per square foot. Applying the wrong county benchmark to a renovation estimate produces errors of $30,000–$80,000 on a typical project.
- Baltimore City cost complexity: Water/sewer liens ($5,000–$30,000+), lead paint compliance, ground rent, party wall requirements, CHAP historic review cost items that are unique to Baltimore City and do not appear in any suburban Maryland market analysis. Missing even one of these items can consume an entire project’s expected net profit.
- Hard money carrying cost reality: Maryland hard money rates of 10.5% — 11.25% mean every month of holding is $1,500–$3,000 in interest on a $200,000 loan before taxes, insurance or utilities. A renovation that runs two months over schedule eliminates $3,000–$6,000 from margin without a single additional renovation dollar spent.
- 2025/2026 market softening: Maryland home price appreciation slowed to 0.8% year-over-year through 2025. ARV calculations built on 2022–2023 appreciation assumptions are systematically too high. In a flat-to-slowing market, only the deals with the correct ARV at current comparable sales, not peak comps, produce the expected margin.
The 6-Gate System Property Analysis for Maryland Fix & Flip
Each gate below is a complete discipline with its own sub-page, methodology and Maryland-specific considerations. A property does not advance to the next gate until it passes the current one. Gate failure at any point means the analysis stops and the decision to walk is made.
GATE 1: ARV Calculation
→ /services/fix-flip/property-analysis/arv-calculation/
The most important number in Maryland flip analysis and the most commonly inflated.
Method: Block-specific Bright MLS comps | 0.25-mile radius | 90-day window | renovated condition | ±20% sq footage
Maryland-specific: Block-level precision required adjacent blocks in Baltimore City differ by $50K–$100K
Gate failure: Confirmed ARV × 70% − Estimated Renovation Cost < Asking Price
Common mistake: Using Spring 2022–2023 peak comps in a 0.8% YoY appreciation market
GATE 2: Renovation Cost Estimation
→ /services/fix-flip/property-analysis/renovation-cost-estimation/
The full cost of bringing the property to the renovated state that justified the Gate 1 ARV.
Maryland county ranges: Baltimore City $150–$250/sq ft | Montgomery/Howard $120–$180 | Frederick/Carroll $80–$120
Always add 20% contingency for hidden conditions in Maryland’s aging housing stock
Gate failure: Full renovation cost > (ARV × 70% − Asking Price)
Common mistake: Using national average benchmarks instead of Maryland county-specific labor rates
GATE 3: Profit Margin Analysis
→ /services/fix-flip/property-analysis/profit-margin-analysis/
The full net profit model not gross margin, but actual dollars after all Maryland-specific costs.
The 30% buffer must absorb: hard money interest (3.5–5.5% ARV) + origination + taxes + insurance + agent commission (5–6%) + closing costs + Baltimore City-specific costs
Non-renovation cost stack: 11%–27% of ARV depending on county and deal structure
Net profit minimum threshold: ≥ 10% ARV or ≥ $25,000 absolute
Gate failure: Full-model net profit falls below minimum threshold after all costs applied
GATE 4: Market Comparable Analysis
→ /services/fix-flip/property-analysis/market-comparable-analysis/
Deep validation of Gate 1 ARV through neighborhood sales dynamics, absorption rate and buyer pool analysis.
5-Layer Comp Stack: Active listings | Pending sales | Sold comps | Expired listings | Neighborhood trend vector
Maryland-specific: Metro proximity premium (PG County), school district boundaries (Howard/Montgomery), waterfront (Anne Arundel)
Gate failure: Market analysis reveals ARV was built on non-representative comps revised ARV fails Gate 3
Red flag: 3+ comparable renovated properties sitting on market at or below your intended resale price
GATE 5: Property Inspection
→ /services/fix-flip/property-analysis/property-inspection/
Physical assessment confirming the renovation scope estimated in Gate 2 or revealing conditions that change it.
Maryland housing stock decade profiles: Pre-1940s (structural brick, knob-and-tube, lead paint) | 1940s–1960s (asbestos, galvanized plumbing) | 1970s (aluminum wiring, HVAC efficiency) | 1980s+ (cosmetic focus)
MHIC-licensed inspection team with Maryland county-specific housing stock expertise
Gate failure: Inspection reveals conditions not estimated in Gate 2 that push total renovation above Gate 3 threshold
Most common discovery: Foundation issues, HVAC replacement need, mold behind finished surfaces
GATE 6: Due Diligence Services
→ /services/fix-flip/property-analysis/due-diligence-services/
Title, liens, permits and code compliance research the Maryland Hidden Cost Map.
Maryland stack: SDAT title | Circuit Court lien search | Baltimore City DPW water/sewer lien | Ground rent (SDAT) | Permit history | Code violations | FEMA flood zone | HOA resale packet
Baltimore City critical: Water/sewer lien ($0–$30,000+) MUST be researched before any offer transfers to buyer
Gate failure: Discovery of lien, violation or title issue that pushes below Gate 3 net profit minimum
Common discovery: $8,000–$22,000 Baltimore City water lien not disclosed by seller or listed on any public portal
🔶 Run the 6-Gate System on Your Next Maryland Property
Complete analysis before any offer ARV through due diligence, all 7 counties.
📞 (410) 413-0739
📧 info@fortunehomesmd.com
→ ARV Calculation | → Renovation Cost Estimation | → Profit Margin Analysis
The 70% Rule and What It Misses in Maryland
The 70% rule (ARV × 70%) − Renovation Cost = Maximum Allowable Offer is the standard Maryland flip entry screen. It is useful as an initial filter, but insufficient as the complete analysis. The 30% buffer must absorb every cost between acquisition and net profit and in Maryland, those costs are substantial.
MAO = (ARV × 70%) − Renovation Cost
Maximum Allowable Offer initial screen only. Full Gate 3 net profit model required before offer placement.
Non-Renovation Cost | Low %ARV | High %ARV | Maryland Notes |
|---|---|---|---|
Hard money interest (6-month hold) | 3.5% | 5.5% | 10.5%–11.25% annual rate on acquisition loan |
Hard money origination fee | 0.5% | 1.0% | 1.5%–2.99% of loan amount |
Property tax hold period | 0.6% | 1.1% | Baltimore City 2.248%; suburban counties 1.0%–1.3% |
Insurance + utilities | 0.2% | 0.5% | Builder’s risk policy + active utilities during reno |
Agent commission at resale | 5.0% | 6.0% | Both sides; investor-friendly agents 4.5–5% sometimes |
Seller closing costs at resale | 1.5% | 2.5% | MD transfer + recordation taxes, title |
Buyer closing cost contribution | 0.0% | 3.0% | Common in PG County FHA buyer transactions |
Baltimore City-specific costs | 0.0% | 7.5% | Water/sewer lien, lead paint, ground rent, CHAP permits |
TOTAL NON-RENOVATION COSTS | 11.3% | 27.1% | Leaving 2.9%–18.7% of ARV as actual net profit after all costs |
Source: Hard Money Bankers Maryland Jan 2026; ATTOM Q2 2025; Real Estate Skills Maryland 2025. Ranges are illustrative; actual costs vary by property, county and deal structure.
Maryland County Analysis Profiles
County | ARV Range | Reno $/sqft | Net Profit Est. | Key Analysis Flags |
|---|---|---|---|---|
Baltimore City | $180K–$550K+ | $150–$250 | $45K–$120K | Water/sewer lien, lead paint, ground rent, CHAP, block-level ARV, party wall |
Montgomery County | $380K–$750K+ | $120–$180 | $60K–$140K | CHAP historic districts, HOA restrictions, premium finish required for ARV support |
Howard County | $400K–$800K+ | $120–$175 | $70K–$160K | School district boundary, HOA condo bylaws, premium finish requirement |
Prince George’s Co. | $250K–$480K | $100–$150 | $45K–$100K | Metro proximity premium, FHA buyer pool (3% CC contribution common), HOA delinquency |
Anne Arundel County | $280K–$520K | $100–$150 | $50K–$110K | FEMA flood zone (waterfront), septic vs. sewer, military buyer pool |
Frederick County | $340K–$600K+ | $80–$120 | $60K–$130K | USDA rural financing, strong appreciation trajectory, lower labor cost base |
Carroll County | $300K–$450K | $80–$115 | $45K–$95K | USDA rural zones, slower DOM, conservative ARV lowest carrying cost risk profile |
Source: Hard Money Bankers Maryland neighborhood analysis Sep 2025; Real Estate Skills Maryland 2025; ATTOM Q2 2025. Illustrative ranges actual results vary by property and market conditions.
What Our Maryland Property Analysis Service Delivers
- ✅ Block-specific ARV Bright MLS comps, 0.25-mile radius, 90-day window, renovated condition matched to planned scope
- ✅ County-calibrated renovation cost Itemized scope at Maryland labor and material rates, 20% contingency built in
- ✅ Full net profit model Hard money financing, all holding costs, transaction costs, Baltimore City-specific items not just gross margin
- ✅ Neighborhood dynamics analysis Days on market, list-to-sale ratios, active competition, buyer demand
- ✅ MHIC-licensed property inspection Structural, mechanical, cosmetic Maryland housing stock expertise by decade
- ✅ Complete Maryland due diligence Title, liens, water/sewer, ground rent, permits, code violations, FEMA flood, HOA
- ✅ Maximum Allowable Offer (MAO) The offer ceiling that protects the minimum 10% ARV net profit after every cost
- ✅ Pass/Walk decision report Written gate-by-gate analysis with clear proceed or walk recommendation
The 70% Rule and What It Misses in Maryland
The 70% rule (ARV × 70%) − Renovation Cost = Maximum Allowable Offer is the standard Maryland flip entry screen. It is useful as an initial filter, but insufficient as the complete analysis. The 30% buffer must absorb every cost between acquisition and net profit and in Maryland, those costs are substantial.
MAO = (ARV × 70%) − Renovation Cost
Maximum Allowable Offer initial screen only. Full Gate 3 net profit model required before offer placement.
Non-Renovation Cost | Low %ARV | High %ARV | Maryland Notes |
|---|---|---|---|
Hard money interest (6-month hold) | 3.5% | 5.5% | 10.5%–11.25% annual rate on acquisition loan |
Hard money origination fee | 0.5% | 1.0% | 1.5%–2.99% of loan amount |
Property tax hold period | 0.6% | 1.1% | Baltimore City 2.248%; suburban counties 1.0%–1.3% |
Insurance + utilities | 0.2% | 0.5% | Builder’s risk policy + active utilities during reno |
Agent commission at resale | 5.0% | 6.0% | Both sides; investor-friendly agents 4.5–5% sometimes |
Seller closing costs at resale | 1.5% | 2.5% | MD transfer + recordation taxes, title |
Buyer closing cost contribution | 0.0% | 3.0% | Common in PG County FHA buyer transactions |
Baltimore City-specific costs | 0.0% | 7.5% | Water/sewer lien, lead paint, ground rent, CHAP permits |
TOTAL NON-RENOVATION COSTS | 11.3% | 27.1% | Leaving 2.9%–18.7% of ARV as actual net profit after all costs |
Source: Hard Money Bankers Maryland Jan 2026; ATTOM Q2 2025; Real Estate Skills Maryland 2025. Ranges are illustrative; actual costs vary by property, county and deal structure.
Maryland County Analysis Profiles
County | ARV Range | Reno $/sqft | Net Profit Est. | Key Analysis Flags |
|---|---|---|---|---|
Baltimore City | $180K–$550K+ | $150–$250 | $45K–$120K | Water/sewer lien, lead paint, ground rent, CHAP, block-level ARV, party wall |
Montgomery County | $380K–$750K+ | $120–$180 | $60K–$140K | CHAP historic districts, HOA restrictions, premium finish required for ARV support |
Howard County | $400K–$800K+ | $120–$175 | $70K–$160K | School district boundary, HOA condo bylaws, premium finish requirement |
Prince George’s Co. | $250K–$480K | $100–$150 | $45K–$100K | Metro proximity premium, FHA buyer pool (3% CC contribution common), HOA delinquency |
Anne Arundel County | $280K–$520K | $100–$150 | $50K–$110K | FEMA flood zone (waterfront), septic vs. sewer, military buyer pool |
Frederick County | $340K–$600K+ | $80–$120 | $60K–$130K | USDA rural financing, strong appreciation trajectory, lower labor cost base |
Carroll County | $300K–$450K | $80–$115 | $45K–$95K | USDA rural zones, slower DOM, conservative ARV lowest carrying cost risk profile |
Source: Hard Money Bankers Maryland neighborhood analysis Sep 2025; Real Estate Skills Maryland 2025; ATTOM Q2 2025. Illustrative ranges actual results vary by property and market conditions.
What Our Maryland Property Analysis Service Delivers
- ✅ Block-specific ARV Bright MLS comps, 0.25-mile radius, 90-day window, renovated condition matched to planned scope
- ✅ County-calibrated renovation cost Itemized scope at Maryland labor and material rates, 20% contingency built in
- ✅ Full net profit model Hard money financing, all holding costs, transaction costs, Baltimore City-specific items not just gross margin
- ✅ Neighborhood dynamics analysis Days on market, list-to-sale ratios, active competition, buyer demand
- ✅ MHIC-licensed property inspection Structural, mechanical, cosmetic Maryland housing stock expertise by decade
- ✅ Complete Maryland due diligence Title, liens, water/sewer, ground rent, permits, code violations, FEMA flood, HOA
- ✅ Maximum Allowable Offer (MAO) The offer ceiling that protects the minimum 10% ARV net profit after every cost
- ✅ Pass/Walk decision report Written gate-by-gate analysis with clear proceed or walk recommendation
Our Maryland Property Analysis Process
- Initial 70% rule screen: Preliminary ARV, estimated renovation and asking price run through the 70% rule filter. Non-starters eliminated before any resource investment.
- Gate 1 ARV Calculation: Block-specific Bright MLS comp pull. Minimum 3 renovated comps, 0.25 miles, 90 days. ARV confirmed at conservative current market value.
- Gate 2 Renovation Cost Estimation: Property visit + scope build. County-specific labor and material rates applied. 20% contingency added. Preliminary renovation cost locked.
- Gate 3 Profit Margin Analysis: Full cost model: ARV − (acquisition + renovation + hard money + hold costs + transaction + city-specific) = net profit. Gate threshold check.
- Gate 4 Market Comparable Analysis: 5-Layer comp stack. Neighborhood trajectory, active competition, buyer pool and absorption rate analysis. ARV validated or revised.
- Gate 5 Property Inspection: Full interior + exterior physical assessment. MHIC-licensed team. Renovation scope confirmed. Material discoveries fed back to Gate 2–3.
- Gate 6 Due Diligence Services: Title, lien, permit, code violation, FEMA flood and HOA research. Baltimore City DPW water/sewer lien confirmed. All discovered costs run through Gate 3 model.
- Pass/Walk Decision Report: Written 6-gate summary, confirmed financial model, MAO and explicit pass or walk recommendation.
- Offer + Renovation (if pass): Offer at or below MAO. Renovation mobilization at closing scope was locked in Gate 5.
Why Fortune Homes MD for Maryland Property Analysis
Analysis and Execution Under One MHIC-Licensed Roof
The renovation cost estimate in Gate 2 is produced by the same contractor who will execute it. This eliminates the systematic gap between analyst estimates and contractor bids that accounts for a significant share of Maryland flip margin erosion. When the renovation cost is the renovation plan, the financial model in Gate 3 holds in practice, not just on paper.
Block-Level Maryland Market Intelligence
Fortune Homes MD’s analysis team operates across all 7 Maryland counties with the block-level specificity Maryland’s hyper-local markets demand. ARV on a Federal Hill rowhouse versus a Highlandtown rowhouse 2 miles away are different numbers from different comp sets and our analysis reflects that. Renovation cost for a 1920s Baltimore City rowhouse versus a 1975 Anne Arundel rancher is a different scope at different rates and our estimate reflects that too.
6-Gate Discipline Walks When Deals Don’t Work
In a market where 30%–50% of gross profit is consumed by costs many investors do not model, the analysis that identifies a bad deal before acquisition is worth more than any renovation efficiency gain. Fortune Homes MD’s gate discipline means we walk from deals that fail the gates, regardless of how much sourcing time was invested. The walk is the discipline that protects the capital that finds the deal that does work.
Service Areas Property Analysis Maryland
- Baltimore City & Baltimore County Full 6-gate analysis; water/sewer lien, ground rent, lead paint, block-level ARV
- Montgomery County CHAP review, HOA analysis, premium finish calibration
- Howard County School district verification, HOA bylaw review, premium ARV support
- Prince George’s County Metro proximity premium, FHA buyer comp analysis, HOA delinquency
- Anne Arundel County FEMA flood zone, septic/sewer determination, military buyer pool
- Frederick County USDA eligibility, appreciation trajectory, lower labor cost calibration
- Carroll County USDA rural mapping, conservative ARV discipline, lowest carrying cost risk
🔶 Start Your Maryland Property Analysis Today
All 6 gates. ARV through due diligence. Pass/walk decision before any offer is placed.
📞 (410) 413-0739
📧 info@fortunehomesmd.com
🌐 fortunehomesmd.com
→ ARV Calculation | → Renovation Cost Estimation | → Profit Margin Analysis | → Market Comparable Analysis | → Property Inspection | → Due Diligence Services
Frequently Asked Questions Property Analysis Maryland
Maryland fix-and-flip property analysis is the systematic evaluation of a potential acquisition across all dimensions that determine whether the flip will produce a profitable outcome: ARV, renovation cost, profit margin, market comparable sales, physical condition and legal/title due diligence. In Maryland specifically, analysis must account for hyper-local market dynamics block-level ARV variation in Baltimore City, county-specific renovation cost ranges, Baltimore City-specific cost items (water/sewer liens, lead paint, ground rent), and the full hard money financing cost stack that translates gross margin into actual net profit. Fortune Homes MD uses the 6-Gate System to structure this analysis sequentially every gate must pass before the next is evaluated.
The 70% rule (ARV × 70%) − Renovation Cost = MAO is a useful initial screen but is not sufficient as the complete analysis for Maryland flips. Hard Money Bankers, after funding thousands of Maryland flip loans since 2007, confirms that the 30% buffer must absorb hard money interest (3.5–5.5% ARV for a 6-month hold), origination fees, property taxes, insurance, agent commissions (5–6%), closing costs and Baltimore City-specific costs. The non-renovation cost stack in Maryland runs 11%–27% of ARV depending on the county and deal specifics leaving only 2.9% — 18.7% of ARV as actual net profit. Fortune Homes MD’s full Gate 3 Profit Margin Analysis models every cost explicitly.
ARV in Maryland is calculated through a block-specific Bright MLS comparable analysis of a minimum of 3 properties with comparable bedroom/bath counts, square footage within ±20%, similar lot size, renovated condition, sold within 0.25 miles and within the past 90 days. The Maryland-specific requirement is block-level precision: in Baltimore City, adjacent blocks can differ by $50,000–$100,000 in value and produce a completely incorrect ARV if the comp is pulled from the wrong block. National tools like Zillow and Redfin aggregate at neighborhood or zip-code level and cannot produce this block-level precision.
Maryland renovation costs vary by county from $80/sq ft in Carroll County to $250/sq ft for Baltimore City gut renovations. Baltimore City pre-1950s rowhouse gut renovations: $150–$250/sq ft due to structural brick repair, lead paint remediation, outdated electrical and plumbing. Montgomery and Howard Counties: $120–$180/sq ft premium labor market, premium finish standards. Prince George’s and Anne Arundel Counties: $100–$150/sq ft. Frederick County: $80–$120/sq ft. Carroll County: $80–$115/sq ft. Always add a 20% contingency to any Maryland renovation estimate for the hidden conditions routinely discovered in Maryland’s aging housing stock.
The Maximum Allowable Offer (MAO) is the highest price an investor can pay for a fix-and-flip property while maintaining the required minimum net profit. The 70% rule MAO (ARV × 70%) − Renovation Cost is the initial screen. Fortune Homes MD’s full Gate 3 MAO calculation subtracts every real cost: ARV − Renovation − Hard Money Interest − Origination − Hold Taxes − Insurance − Agent Commission − Closing Costs − Baltimore City-specific costs − Minimum Required Net Profit. This full-model MAO is consistently lower than the 70% rule MAO and reflects what the deal will actually deliver in practice.
Maryland due diligence includes: SDAT and Circuit Court title search; Baltimore City DPW water/sewer lien balance (critical $5,000–$30,000+ transfers to buyer); SDAT ground rent database check (Baltimore City); county permit history and open violations; FEMA flood zone status; HOA/condo resale packet review (Maryland 5-day statutory review right); and MHIC-licensed property inspection. Baltimore City requires all these items completed before any offer; the water/sewer line research with DPW is the single most important pre-offer due diligence step for any Baltimore City acquisition.
A complete 6-gate Maryland property analysis typically takes 5–10 business days. Gate 1 (ARV) and Gate 4 (Market Comps) are completed within 24–48 hours using Bright MLS. Gate 2 (Renovation Cost) requires a property visit typically 2–3 days. Gate 3 (Profit Margin) flows same-day from Gates 1–2. Gate 5 (Inspection) is 2–3 hours on-site plus 1–2 days for scheduling. Gate 6 (Due Diligence) takes 2–5 business days for title and lien research. All gates can run in parallel after the initial property visit, compressing to 5–7 business days for a standard Maryland single-family property.
Baltimore City requires several additional analysis steps not needed in suburban Maryland counties. Water and sewer lien balance must be researched at Baltimore City DPW before any offer unpaid balances survive the sale and transfer to the buyer. Ground rent status must be verified through SDAT. Lead paint compliance is mandatory for all pre-1978 renovation; virtually all Baltimore City housing stock is pre-1978. CHAP review is required for properties in designated historic districts. And block-level ARV precision is non-negotiable; comparable sales must be pulled from within 0.25 miles specifically, not from the broader neighborhood.
Three mistakes account for most failed Maryland flips: (1) Inflated ARV using peak 2022–2023 comps, comps from more desirable nearby sub-neighborhoods, or non-renovated comparables in a market where appreciation has slowed to 0.8% YoY. (2) Underestimated renovation costs using national averages instead of Maryland county-specific rates and skipping the 20% contingency. (3) Incomplete cost modeling running a 70% rule screen without modeling hard money financing costs, Baltimore City-specific items and full resale transaction costs. Combined, these three mistakes can take a projected $80,000 net profit down to $15,000 or a loss.
Two structural advantages differentiate Fortune Homes MD’s analysis. First, the renovation cost estimate in Gate 2 is produced by the contractor who will execute the work eliminating the analyst-to-contractor gap that systematically erodes flip margins industry-wide. Second, the 6-Gate System enforces complete analysis before any offer, including full Baltimore City due diligence and a net profit model that explicitly accounts for all Maryland-specific costs. The result is a maximum allowable offer that holds up in execution the deal that looked like $70,000 net profit on paper delivers $70,000 in practice, because the analysis was correct from Gate 1.
Still have a question?
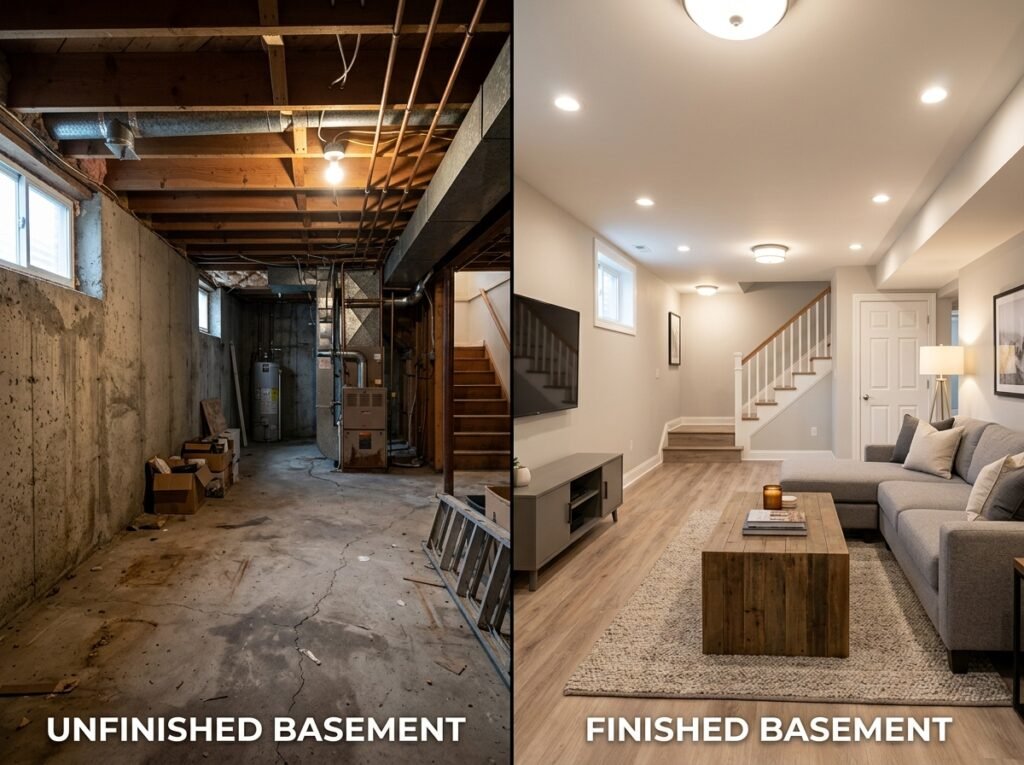
Ready to Finish You Property Analysis Basement?
Feature | Details |
|---|---|
6-Gate System | ARV → Renovation Cost → Profit Margin → Market Comps → Inspection → Due Diligence |
Maryland Rank | #2 most profitable flip state nationally ATTOM Q2 2025 |
Median Gross Profit | $165,000 per flip Q2 2025 (ATTOM). Net is 30–50% lower after all costs. |
70% Rule Formula | (ARV × 70%) − Renovation Cost = MAO (initial screen only full model required) |
ARV Comp Standard | Bright MLS | 0.25-mile radius | 90-day window | renovated condition | block-specific |
Baltimore City Reno Cost | $150–$250/sq ft (gut renovation, pre-1950s rowhouse) |
Suburban MD Reno Cost | $80–$180/sq ft depending on county and scope |
Non-Reno Cost Stack | 11%–27% of ARV most of the 70% rule 30% buffer |
Net Profit Minimum | ≥ 10% ARV or ≥ $25,000 absolute Gate 3 threshold |
Baltimore City Unique Cost | Water/sewer lien ($0–$30K+), ground rent, lead paint compliance, CHAP |
Hard Money Rate (MD) | 10.5%–11.25% + 1.5%–2.99% origination | modeled at Gate 3 |
Service Area | 7 Maryland counties all 6 gates available in all markets |
Phone | (410) 413-0739 |
info@fortunehomesmd.com |